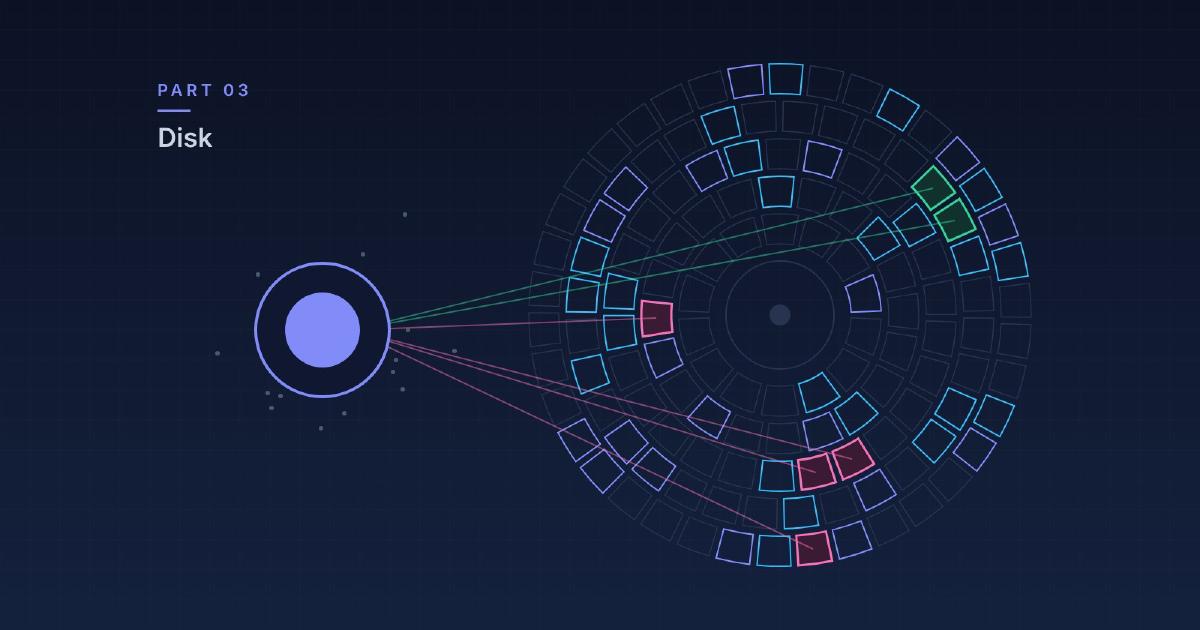
Part 2 ended with memory flagging things and a promise that disk would confirm them. This round I added disk images from the same case. The tool worked, the scores stayed high, and then I found out the score couldn’t tell me the thing I most wanted to know: whether the agent was using what I’d just given it.
Everything below ran on gpt-oss:120b.
Confirming what memory flagged#
The new tool is disk_triage. It reads E01 images
directly with dissect,
with no mounting. As with the other tools, code does
the digging and the model gets a summary to reason
over. It works in tiers:
- Execution and persistence: Amcache, Prefetch, Shimcache, BAM, services, Run keys and scheduled tasks, filtered down to what’s unusual.
- User activity: within two hours of the first hit, browser downloads and history, recent files, jump lists, shellbags, UserAssist and the recycle bin.
- What happened to files and data: USN journal lifecycles, SRUM network use, and Windows Timeline (ActivitiesCache).
When a Run key reads its payload from another
registry value, code reads that value and decodes
it. On this case that’s base64, base64 again, gzip
and then a shellcode loader. Code pulls out the
connect-back address, 203.78.103.109:443, the same
C2 that memory found.
Code also links the hosts: the same unusual binary on two images, and an RDP client launched on one host followed within ten minutes by a new profile on another. That second one gives you the pivot from the DC to the desktop, 51 seconds apart.
The attack, from the disk#
This is The Stolen Szechuan Sauce again, with all times UTC on 19 September 2020. Here’s the desktop once the attacker got there:
| Time | Event | Source |
|---|---|---|
| 03:36:24 | Administrator’s first logon (profile created) | NTUSER.DAT |
| 03:39:29 | Edge shows Directory listing for / | Timeline |
| 03:39:38 | Windows Security opened | Timeline |
| 03:40:01 | coreupdater.exe downloaded from 194.61.24.102 | IE downloads |
| 03:41:21 to 03:42:44 | 4 pastes into cmd.exe | Timeline |
| 03:42:42 | Service coreupdater appears | Services |
| 03:44:03 | Run key coreupdate written | Registry |
| 03:45:34 | Morty’s My Social Security Number.txt opened | Timeline, LNK |
| ~03:46:15 | That file zipped, then renamed loot.zip | USN |
| 03:47:09 | loot.zip deleted | USN |
I like this table because it reads like someone sitting at the keyboard. Windows Security gets opened 23 seconds before the download. Commands get pasted into a prompt, and the service shows up inside that window. The content of the pastes isn’t kept, and “opened Windows Security” doesn’t tell you what they changed, so those are leads rather than facts.
The score that couldn’t see it#
The Timeline rows were the last thing I added. I merged them and ran 10 runs each on the disk and full cases. No regression: 99 / 98 on disk and 98 / 98 on full.
Then I counted how many reports actually mentioned the new rows:
| Row | Disk (of 10) | Full (of 10) |
|---|---|---|
| Attacker’s directory listing | 0 | 0 |
| Windows Security opened | 2 | 4 |
Pastes into cmd.exe | 0 | 0 |
Even that flatters it. I read those Windows Security lines, or at least the ones in the full case, and they were all about the Windows Security event log: “collect Windows Security (4624) logs”. Not one was about the app. My grep was wrong in the optimistic direction.
None of my checks looked for these rows, so the score had no way of noticing. It was 99 because everything else was still right.
Three attempts#
Attempt 1: tell it what they mean. The tool’s description didn’t mention Timeline, and neither did the analyst guide. Easy fix, surely. I added both.
Result: scores went up a touch. Mentions went to 0 of 20.
That’s the part I’d have got wrong if I’d only looked at the score. It looked like the fix had worked. It was noise.
Attempt 2: find out if it can even see them. Before trying anything else I sent the model the guide and the raw disk output, with one question: list everything the Administrator did between 03:38 and 03:48. No agent loop, no report.
It listed the directory listing and Windows Security, and credited them to Timeline. So it could read them. It missed the pastes, which sit in their own section as a time range rather than in line with everything else. Asked directly, it mostly knew. It just wasn’t choosing to put them in a report.
Attempt 3: labels and a hard rule. Labels had
worked before. Rows marked <- archive get reported,
and that guide line says “always”. So I labelled
these rows <- plain web server and
<- commands pasted, and told it to always include
them in the matching finding.
Result: 0 of 20. Again.
Enforce it in code#
That’s the design rule from Part 1, and I should have started there. If something has to be in the report, don’t ask the model nicely. Code now copies those labelled rows into an auto-generated section:
## Disk activity leads (auto-generated)
- DESKTOP-SDN1RPT: 03:39:29Z  Administrator  Microsoft Edge
  Directory listing for /  <- plain web server
- DESKTOP-SDN1RPT: 03:39:38Z  Administrator  Windows Security
  <- Windows Security opened
- DESKTOP-SDN1RPT: 03:41:21Z to 03:42:44Z  Administrator
  4 x into cmd.exe  <- commands pasted
The analyst gets those rows every time, copied exactly from the tool. The trade-off is that it isn’t the model’s analysis. It won’t tie them into the story, and it’s ungraded, so it doesn’t count toward the score. I still don’t know exactly why the model leaves them out.
“No evidence of DCSync (T1003.006)”#
While I was in there, dcsync kept turning up as a
failure, with 2/10 reports naming a technique that
never happened on this case. That looks like a
hallucination. Reading the reports, not one claimed
it:
- The grader was wrong. It ignores a word if a
negation like “no evidence of” comes just before
it. But it stopped looking at full stops, and two
failing reports said
(e.g., LSASS access, DCSync. The dots in “e.g.” hid the negation. - My code was making it worse. A helper adds the right ATT&CK ID to any behaviour the report names, and it couldn’t tell a finding from a denial. So in 6 of 7 reports code had written “No evidence of DCSync (T1003.006)”. That’s an ID for something that didn’t happen, added by my code, not the model.
I fixed both. The tagging fell from 6 of 7 reports to 2 of 10. The failure stayed at 2/10 though, with new wording: one denial ran past the 70 characters the pattern looks through, and one next step started with “Review”, which isn’t on its list. Neither is a claim that DCSync happened.
I left those alone. I could keep adding words until
the check passes, but the longer that list gets, the
easier it is to excuse a real false claim. So if
dcsync fails now, I read the line.
Second post in a row where a bug that looked like the model was mine.
Moving to dfirbox#
I also retired the SIFT VM. The agent’s tools now run on my own Ubuntu VM on Proxmox, with the same 7 cases all within a point of their old scores. Newer tool versions changed very little, though one process count did move by one.
The one thing that bit me was RunPod. My template set
PUBLIC_KEY explicitly and still held the deleted
VM’s key, so a new pod rejected my correct account
key. Worth knowing if you ever wonder why an account
key isn’t working.
Where it’s at#
gpt-oss:120b, average / fixed checks, 10 runs each,
commit ec06615
(how these are scored is in
Part 1):
| Case | Score |
|---|---|
| APT29 day 1 | 99 / 99 |
| Lateral movement | 99 / 100 |
| Credential dumping | 100 / 100 |
| Multi-stage APT | 100 / 99 |
| Szechuan Sauce (memory) | 100 / 100 |
| Szechuan Sauce (disk) | 99 / 99 |
| Szechuan Sauce (memory + disk) | 98 / 97 |
The memory + disk case is still the weakest. Its biggest miss is the zipped SSN file, at 4/10 this round, which I’ll keep an eye on.
Lessons from this round#
- A high score only covers what you check. Adding evidence with no check for it can’t move the score, whether the agent uses it or not.
- Count the thing you changed. A score rising after a fix isn’t proof the fix worked. Here it was noise.
- Read what your grep matched. “Windows Security” meant the event log, and it made the feature look like it half worked.
- Test the model on its own. One direct question separated “can’t read it” from “won’t report it” in about a minute.
- If it must be there, enforce it in code. I wrote that in Part 1 and still spent two batches on prompt wording first.
Next#
- Velociraptor offline collections as an evidence type.
- The Mac Studio, so this can run on real evidence off rented GPUs.